

The Cleveland conundrum
Ohio Democrats need robust turnout in Cleveland to win statewide. That has been a problem since Obama left office.


This post is too long for email. Please open your browser to view in full.

The Thursday dispatch will be the February mailbag.
You can submit political and non-political questions anonymously through the Jotform.
An eclectic mix of questions is what makes the Mailbag fun to write, so please feel free to sound off with any question you might have.
Today’s dispatch features an analytical missive from Cleveland-based freelancer Ky. A Hoga.
Ohio Democrats have not shown an ability to win statewide without a robust voter turnout in Cleveland. Maybe that will change in the future as Columbus and Central Ohio continue to grow. But until then, we’ll go to war with the electorate we have, not the one we want.
And frankly, it’s not looking good if we’re depending on Cleveland. I’ll return after the jump.
The wheel keeps on turning in Cleveland
Cuyahoga County has its next set of candidates for the Democratic Party’s Central Committee.
The vote is set for May 5.
You won’t catch any media coverage of these hyper-hyper-local races, though, arguably, these elections are key to robust local, state, and federal elections—especially for Democrats.
And as neighbors decide a) whether or not they’re even going to participate in this election, and b) who it is that they’re going to vote for (assuming they have a choice), it’s important they have something to reference as they make their decision at the ballot box.
Cleveland Voter Turnout
For this examination, we’ll focus on turnout in comparable general elections from 2018 and 2022, 2019 and 2023, and 2020 and 2024.
The data is available through the Cuyahoga County Board of Elections. And while Cleveland underwent redistricting last year that resulted in the loss of two wards, we’ll highlight the results through 2024 for ease of comparison.
The results? They’re pretty bad…
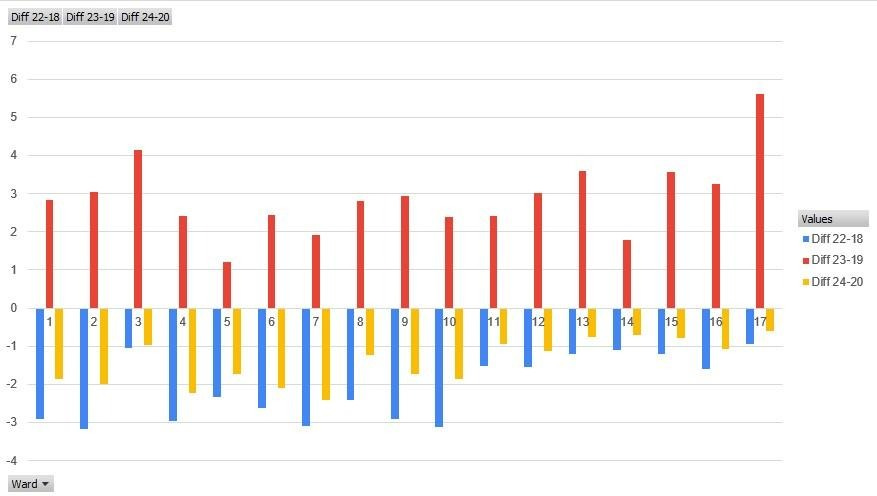
Every single ward saw a decrease in voter turnout from the 2020 presidential to the 2024 presidential, with the average decrease being 1.4%.
The ward with the greatest decrease was the old Ward 7 (which is generally the new Ward 8), and the smallest decrease was the old Ward 17 (which is generally the new Ward 15).
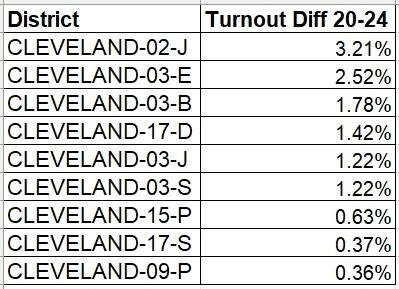
At the precinct level, only nine precincts managed to increase voter turnout between the 2020 presidential and the 2024 presidential: 2-J, 3-E, 3-B, 17-D, 3-J & 3-S, 15-P, 17-S, and 9-P.
On the other hand, every single ward saw increased voter turnout from the 2019 general election to the 2023 general election, which was the year Cleveland primarily voted on issues, including at the state level (abortion and marijuana) and at the city level (participatory budgeting).
The average increase in voter turnout as compared to the previous cycle’s election year was nearly 3%. The ward with the smallest increase was the old Ward 5 (which is generally the new Ward 5), and the ward with the greatest increase was the old Ward 17 (which is generally the new Ward 15).
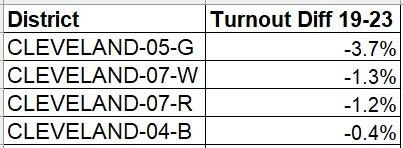
At the precinct level, the only precincts that didn’t increase voter turnout were 5-G, 7-W, 7-R, and 4-B.
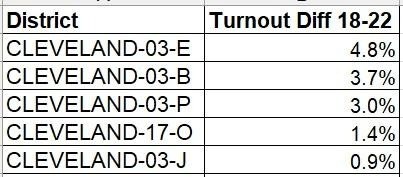
Similar to the comparison between ‘24 and ‘20, every single ward saw decreased voter turnout from the 2018 midterms to the 2022 midterms, with the average decrease being rather large at -2.1%.
The ward with the greatest decrease was the old Ward 2 (which is generally the new Ward 2), and the ward with the smallest decrease was the old Ward 17 (which is generally the new Ward 15).
And at the precinct level, only five precincts saw increased voter turnout between the 2018 midterms and the 2022 midterms: 3-E, 3-B, 3-P, 17-O and 3-J.
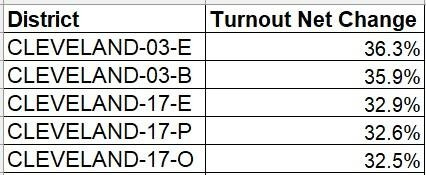
According to what we’ll call ‘net change’, or simply the sum of the differences between each of the three comparable election years, the top five performing precincts in Cleveland are 3-E (which is 7-E now), 3-B (which is 7-B now), 17-E (which is 15-E now), 17-P (which is 15-P now), and 17-O (which is 15-O now).
The current CCDP Central Committee members for these pre-2025 redistricting precincts (including their current precinct) are:
7-E (formerly 3-E) – Chris Martin:

7-B (formerly 3-B) – Ellen Kubit:
15-E (formerly 17-E) – VACANT
15-P (formerly 17-P) – John Henry:

15-O (formerly 17-O) – Nora C. Kelley:

Folks familiar with Cleveland politics speak to the role the city’s legacy of segregation and prejudiced economic development has played in these voter turnout results, including the never-ending attempts from Columbus to disenfranchise poor and/or minority voters up here on the lake.
But it is interesting to consider that there are successes occurring throughout a city that has anemic voter turnout.
In many ways, the map of low voter turnout in Cleveland is not that different from the map of where poverty, homelessness, hunger, lead poisoning, violence, etc., are at their worst.
Which, uncoincidentally, is also the map of where segregation is strongest.
And so begins the self-fulfilling prophecy: 1) campaigns don’t engage with Black Cleveland because Black Cleveland doesn’t vote, 2) because campaigns don’t engage with Black Cleveland, they don’t vote, 3) thus proving to the campaigns that there is no benefit in engaging with Black Cleveland because they don’t vote.
To quote Andrew Tobias from the first State Signal of the new year: Will 2026 be the year Ohio Democrats become relevant?
Not until they care about Cleveland voter turnout.
Fake internet pedophile currency rocked by revelations of early investment from an infamous dead pedophile

 | A guest post by
|